

Lesson 2.1: Educational Budgeting—Revenue and Expenditure
The Architecture of School Finance
School budgeting is not just about counting money; it is about forecasting. An institutional budget is usually set 6–9 months before the academic year begins.
1. Revenue Streams (The Inflow)
Administrators must understand where the “blood” of the institution comes from:
- Primary Revenue: Tuition fees (the most significant and volatile source).
- Ancillary Revenue: Transportation fees, canteen commissions, uniform sales, and facility rentals (hiring out the football pitch on weekends).
- Development Funds: Government grants (e.g., SME support in the UAE), corporate sponsorships, or alumni donations.
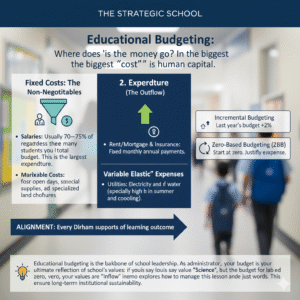
2. Expenditure (The Outflow)
- Fixed Costs: Salaries (usually 75% of a school’s total budget), rent, and insurance.
- Variable Costs: Utilities (electricity/water), classroom supplies, and marketing.
The Strategic Budgeting Process
You will learn to move away from “Incremental Budgeting” (taking last year’s budget and adding 2%) toward Zero-Based Budgeting (ZBB). In ZBB, every department starts at zero and must justify every expense based on its impact on student learning.
Educational budgeting is the backbone of school leadership. As an administrator, your budget is the ultimate reflection of your school’s values: if you say you value “Science,” but your budget for lab equipment is zero, your values are just words. This lesson explores how to manage the “Inflow” and “Outflow” of capital to ensure long-term institutional sustainability.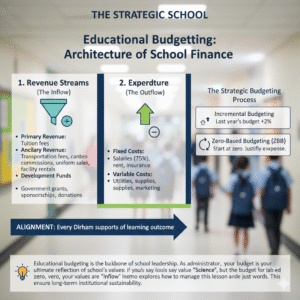
- The Architecture of School Finance
School finance is unique because it is cyclical and seasonal. Most schools receive the bulk of their revenue during specific enrollment windows (e.g., August/September), but they must stretch those funds to cover expenses for 12 months.
Forecasting vs. Accounting
- Accounting looks backward (What did we spend?).
- Forecasting looks forward (How many students will we have in 9 months?).
Strategic leaders set their budgets 6–9 months in advance to prepare for faculty recruitment and facility upgrades.
- Revenue Streams (The Inflow)
A school’s survival depends on the diversity and stability of its “Inflow.” Relying 100% on tuition is a high-risk strategy.
- Primary Revenue: Tuition Fees
This is the lifeblood of the institution. However, it is volatile because it depends on student retention. If 50 students leave unexpectedly, the school loses a massive chunk of its operating budget.
- Ancillary Revenue (Side Streams)
These are “value-added” services that pad the profit margins.
- Transportation & Canteen: Commissions from bus services or food vendors.
- Uniform Sales: Direct sales or licensing fees.
- Facility Rentals: Hiring out the auditorium or football pitch to the community during evenings and weekends.
- Development Funds
External capital that doesn’t come from parents.
- Grants: Government subsidies for innovation or sustainability (e.g., solar panels).
- Corporate Sponsorship: Partnerships for branded labs or sports kits.
- Expenditure (The Outflow)
Where does the money go? In a school, the biggest “cost” is human capital.
Fixed Costs: The Non-Negotiables
These stay the same regardless of how many students you have.
- Salaries: Usually 70–75% of a school’s total budget. This is the largest expenditure.
- Rent/Mortgage & Insurance: Fixed monthly or annual payments.
Variable Costs: The “Elastic” Expenses
These fluctuate based on usage or student numbers.
- Utilities: Electricity and water (especially high in summer for cooling).
- Marketing: Costs for open days, social media ads, and brochures.
- Classroom Supplies: Paper, art supplies, and specialized lab chemicals.
- Moving Toward Zero-Based Budgeting (ZBB)
Traditional schools use Incremental Budgeting (taking last year’s budget and adding 2–5%). This is inefficient because it carries over old mistakes. Strategic leaders use Zero-Based Budgeting.
The ZBB Philosophy:
- Every department starts at $0 every year.
- Every dollar requested must be justified by its impact on student learning.
- Example: The Art Department cannot say “We want $5,000 because we had $5,000 last year.” They must say “We need $5,000 to implement the new digital photography curriculum which aligns with our 3-Year Strategic Plan.”
- The Strategic Budgeting Flow
This diagram shows the path from initial forecasting to final audit.
- Financial Case Study: The “Efficiency Shift”
Consider a school facing a 10% increase in utility costs.
|
Old Strategy (Incremental) |
New Strategy (Strategic) |
|
Cut the “Marketing” budget by 10% to cover the cost. |
Move to ZBB for all departments. |
|
Result: Fewer new students enroll, leading to a revenue deficit next year. |
Result: Found $15,000 in unused “legacy” subscriptions in the IT department to cover the utility spike without hurting marketing. |
- Administrator’s Budgeting Checklist
- [ ] The 75% Rule: Are your staff salaries exceeding 75% of total expenditure? (If yes, you are at financial risk).
- [ ] The Rainy Day Fund: Have you set aside a 3–5% “Contingency Fund” for emergencies?
- [ ] Utilization: Is the school building “earning its keep” during weekends and holidays via rentals?
- [ ] ROI on Staff: Are we spending on professional development that actually improves student results (and thus retention)?